Context
The Master’s of Computer, and Information Sciences program at Cornell University has a mandatory capstone requirement in which students are paired up with industry professionals to work alongside on a project that spans the duration of a semester. I was very fortunate to be paired up with Morgan Stanley's executive team.Morgan Stanley is an American multinational investment bank and financial services company headquartered at 1585 Broadway in the Morgan Stanley Building, Midtown Manhattan, New York City. With offices in more than 42 countries and more than 55,000 employees, the firm's clients include corporations, governments, institutions and individuals.

Side Note: Since this was not a UX oriented project, and because I was limited on time; I opted to focus on it from a Software Engineering perspective, and tried to sprinkle in as much human centered design principles as I could along the way.
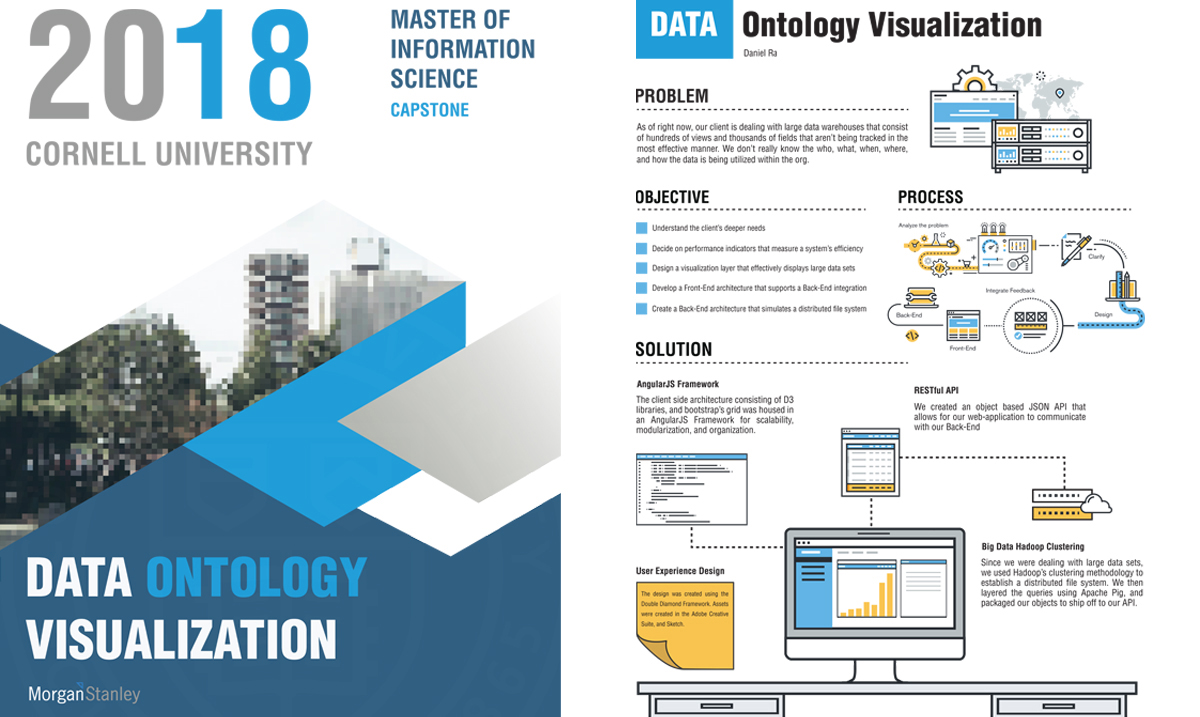
Data Ontology Visualization Project
Problem: As of right now, the client is dealing with large data warehouses that consist of hundreds of views and thousands of fields that aren’t being tracked in the most effective manner. They don’t really know the who, what, when, where, and how the data is being utilized within the org.
Objectives
• Discover the underlying needs of the users
• Decide upon performance indicators that are best suited for measuring a system’s efficiency
• Design an effective visualization layer that displays large data sets
• Develop a pipeline with a synced distributed file system
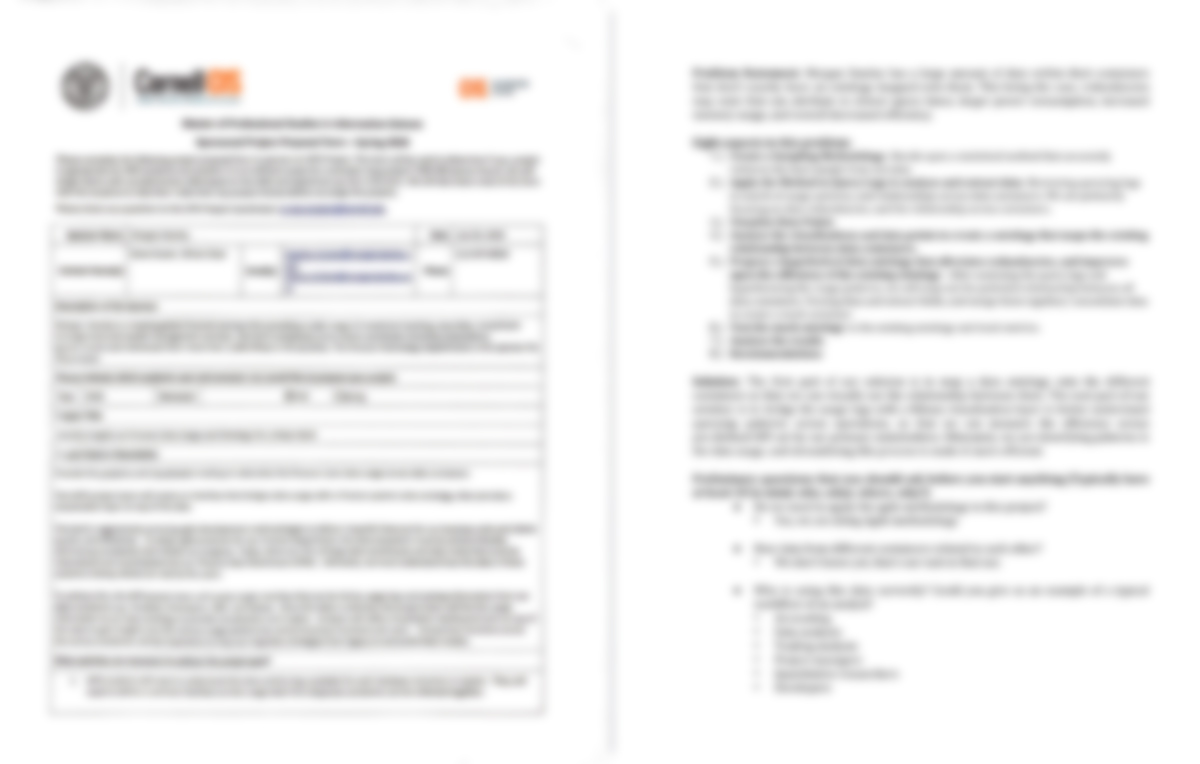
[Original Master’s Capstone Project Briefing + My Interpretation On The Right.]
The first thing I had to do was interpret the briefing. What is this project about? Who is using this product? What problem am I trying to solve? Afterwards I did my best to summarize the contents of the initial report into a project plan.
Brainstorming A Potential Architecture
Following the initial client meeting. I started to draft out a system of how something like this would be brought to life. Initially I attempted to go along with an Angular + D3 architecture…however, due to the limitations on time, and resources; I ended up switching to a more popular software solution, the Elastic Stack (Logstash, Elasticsearch, and Kibana).
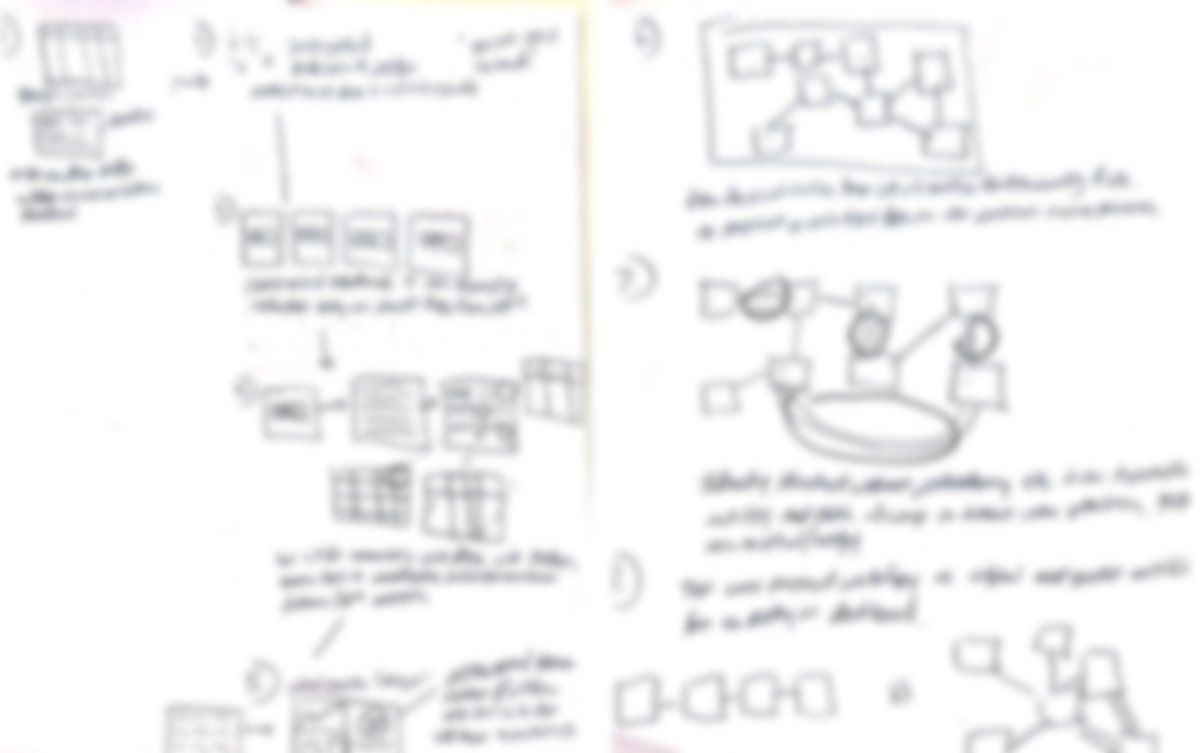
[Initial Paper Drafting Of Architecture.]
Generating Mock Data
Due to the sensitive nature of the data that I was working with, it took awhile for legal to approve a small set of mock data to be sent out. I was given a fragment of a query, and a list of potential mock fields that would be contained within a sample data container. With this knowledge I drafted out a mock schema, and wrote a Python script to help automate randomized sets of queries to feed into my Elasticsearch.
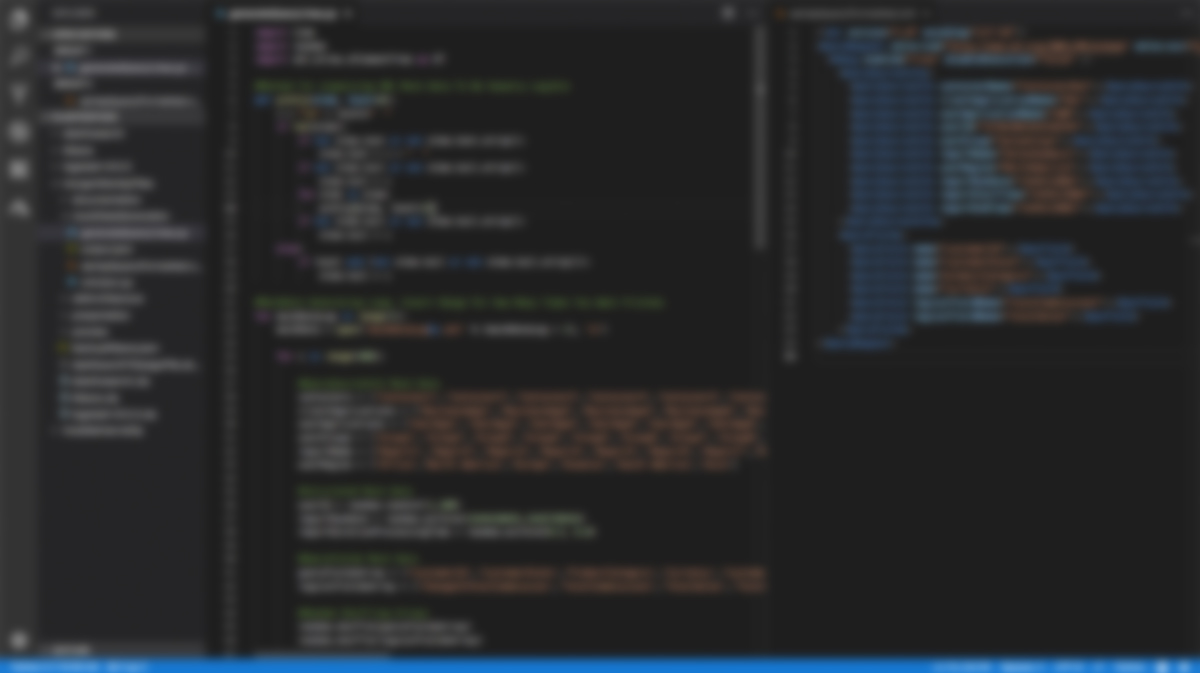
[Python Scripting For Generating Dynamic Mock XML Logs.]
Setting Up A Pipeline Via Logstash
Logstash is the L within the ELK stack. Its purpose is to not only act as a pipeline, but also as a data parsing tool. This being the case, it’s best practice to try and clean up, and parse your raw data, prior to having it indexed within Elasticsearch. To do this I had to apply the XML filter, as well as various other mutation, and conditional statements to effectively convert my XML logs into an acceptable JSON object.
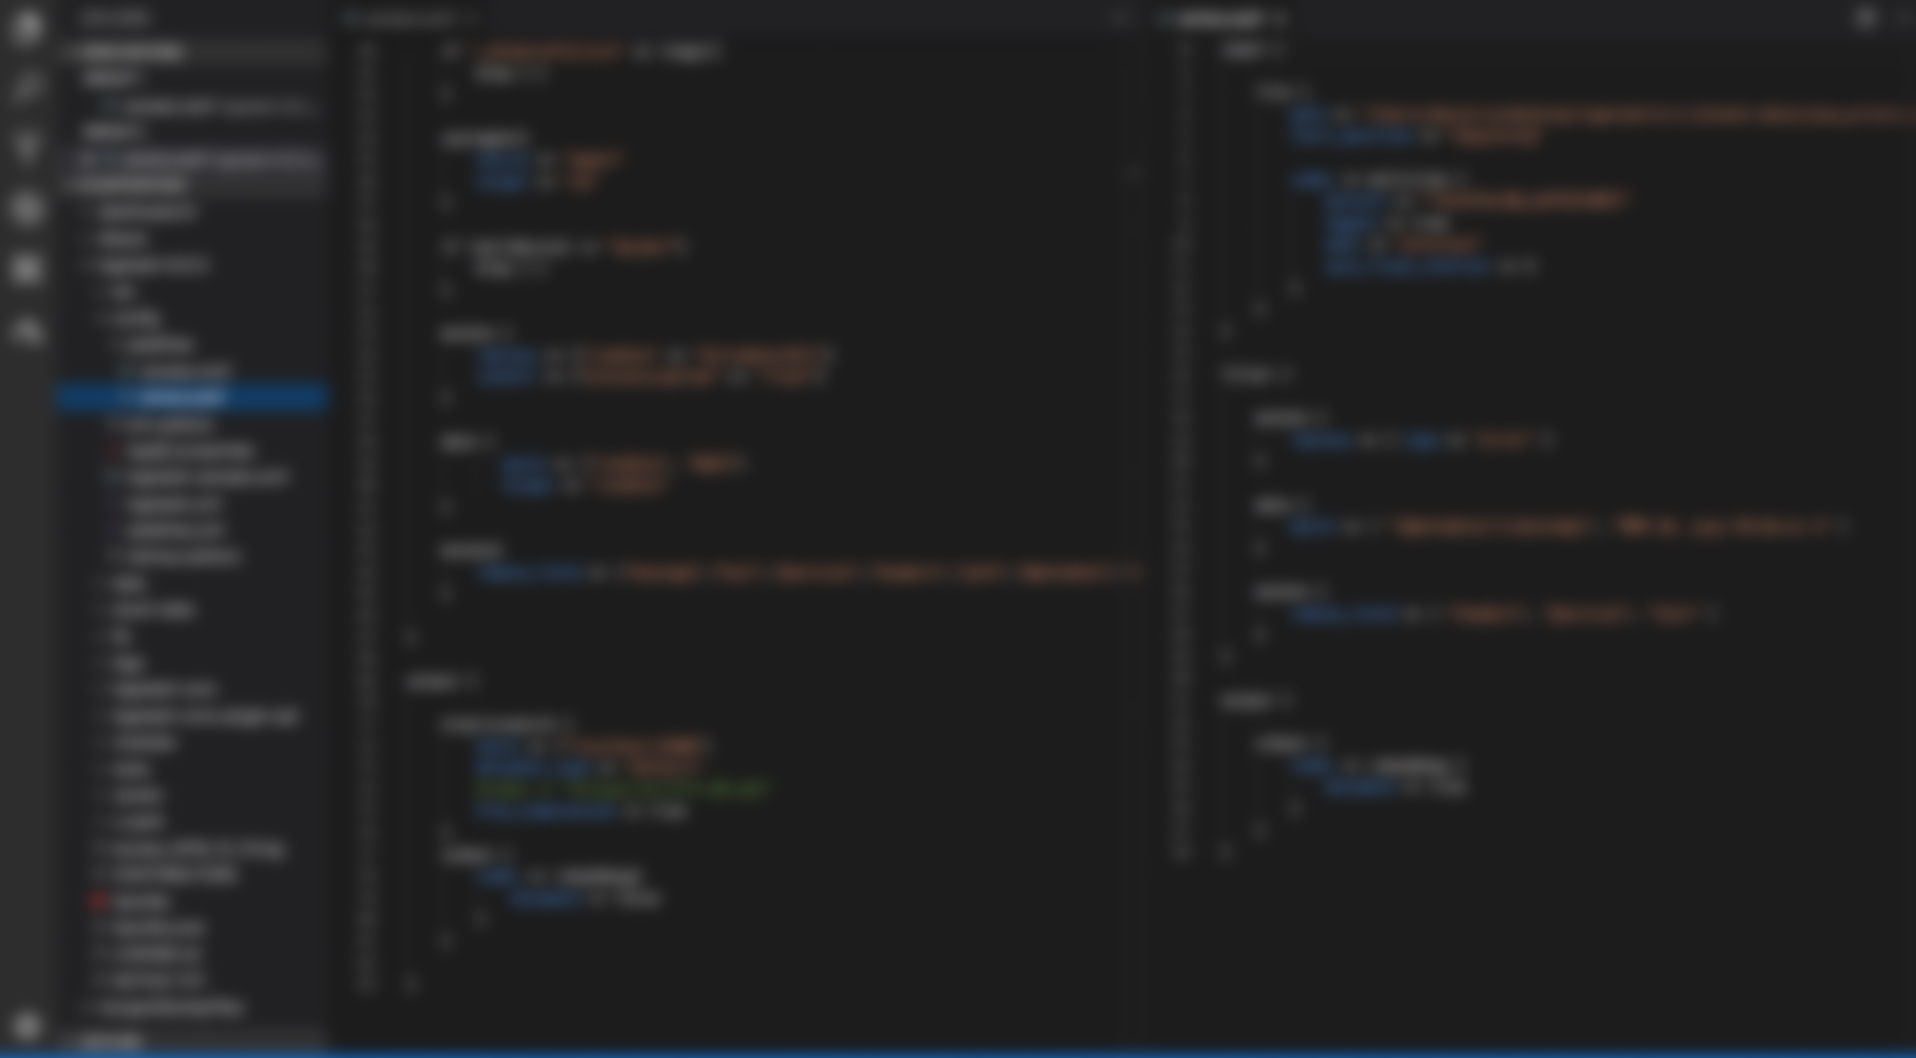
[Logstash Multi-Pipeline Configuration.]
I then set up two pipelines, one for errors and the other for access. Once data from an event has gone through the codec it then gets sent into a working queue, afterwards the batch runs through the filters, and outputs the specifications within your conf file.
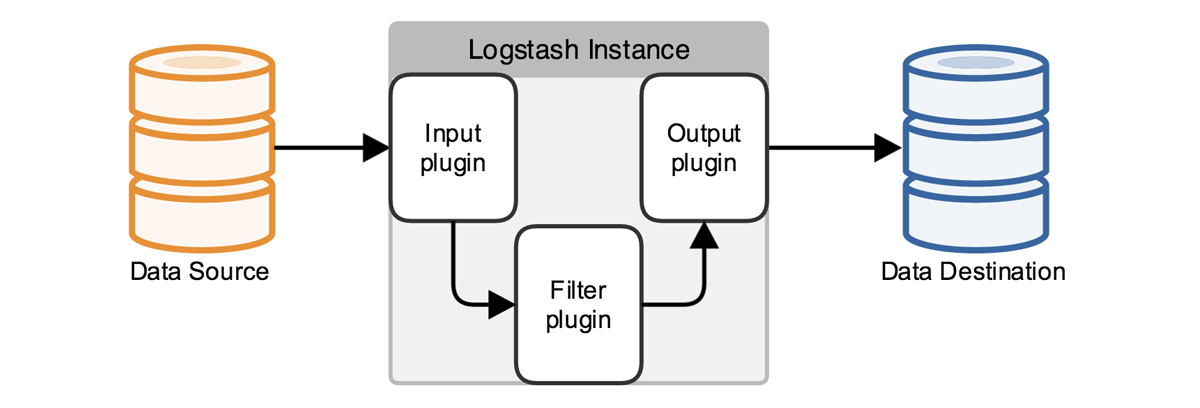
[How Logstash Works On A Architecture Level.]
There are two primary ways to send data to Logstash. One is through an http POST request from a client, and the other is to set a primary file path directory that matches a wildcard. I set up both, within the conf file, and tested them with Postman.
[Postman Testing RESTful API Calls + Targeted File Directory.]
Indexing In Elasticsearch
The XML filtering within Logstash was only a direct conversion of the log data into a multi-lined nested JSON object, that wasn’t very optimal for the use cases mentioned above. Thus, I had to pull out and replicate fields from their nested lines to flatten them out. However, I still had to preserve the objects structure in order to have Elasticsearch recognize them as individual objects as opposed to the default behavior.

[Establishing An Indexing System, Calling the Elasticsearch Indexing API.]
Afterwards, I mapped out keywords for aggregations, and converted some fields into the numerical types best representative of their data. I then proceeded to create an indexing pattern with a wildcard Identifier to match the outputted files of my mock data.Visualizing Data Within Kibana
Now if the data has been properly parsed, and indexed within Elasticsearch, Kibana is the easy part. You just simply add a new visualization; select your chart type, and then specify the fields that you want to cross. Following which, you then add those visualizations onto a dashboard.
[Kibana Dashboard Configuration With Visualization Components.]
What I Learned
All in all, I would say that my experience with the CIS capstone project has been phenomenal. I got to learn a new technology stack, I was able to work alongside C level executives from Morgan Stanley, but most importantly I believe that the capstone project taught me how to manage my time more efficiently. This semester has been a real balancing act between communicating weekly with clients, and struggling to stay on top of my heavy course-load. However, because of these trials I’ve become better prepared for the industry.
[Final Poster Session For Symposium.]