Context
I interned at NBBJ Seattle during the spring of 2016. Nbbj was founded in 1943, and houses 11 offices all across the globe. They are one of the biggest architecture firms in the United States, and collaborate regularly with big names such as Google, Amazon, Samsung, and Stanford University.Over the course of my 4 months, I was tasked with various projects ranging from intrasite redesigns, automating HR Employee documentations, to creating the employee-training portal. However, for confidentiality purposes I can only detail a small portion of the intrasite redesign process (1st Loop).

[Nbbj's Latest Project, The Amazon Bio-Dome.]
Role: I was tasked with the user-research, design, and the front-end development for this project. I collaborated with our in-house web designer.
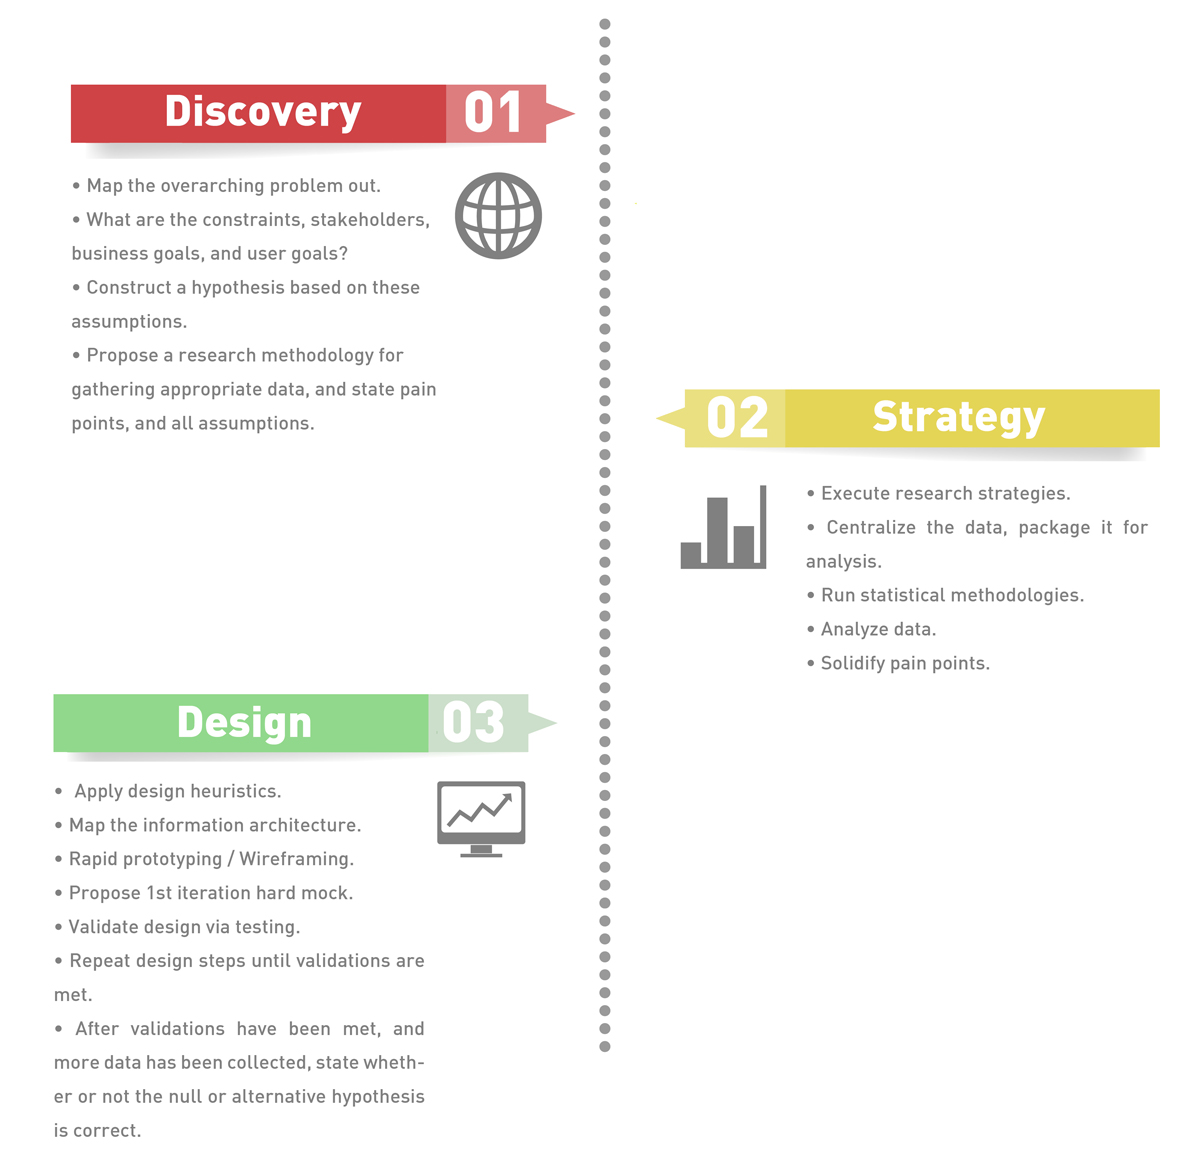
[My Design Process.]
Problem
- There is too much information within the site that draws attention away from what the user is seeking, I. E. Quick links, and Related Sites having too many links that are archaic, or no longer widely prevalent.
- Users are not responding to the news articles or milestones being posted.
- Users aren’t performing their intended tasks as efficiently as possible.
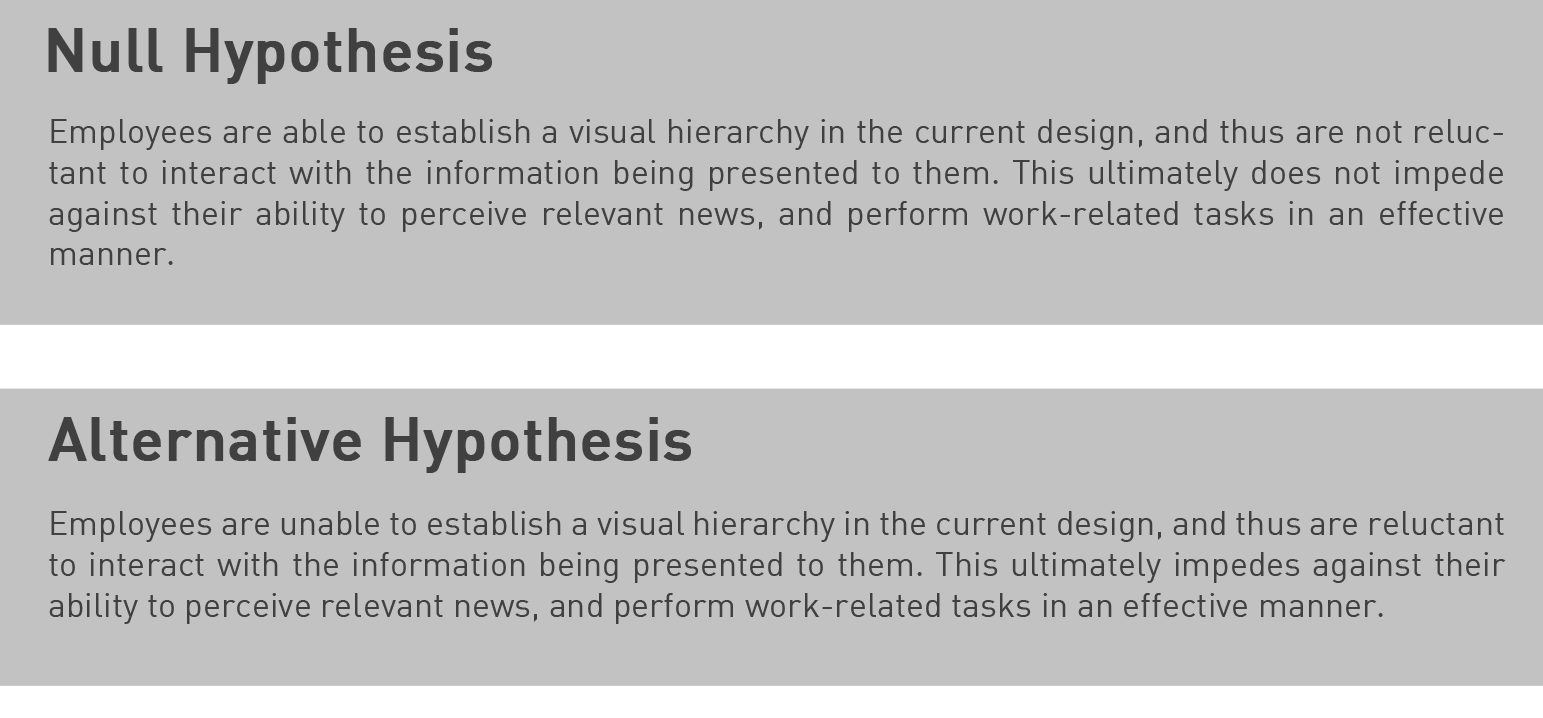
[Null, and Alternative Hypothesis Proposition.]
Primary Objective: Ultimately, the purpose of this redesign is to increase the efficiency at which employees perform their tasks, and also increase the responsiveness to news and updates being released by the company. We would also like to remove unnecessary clutter that detracts from the user's-experience.
Secondary Objective: In addition to the main objective, we also wanted to take a look into increasing the efficiency of some of our more popular tools.
Key Performance Indicators
- Average time spent doing a particular task.
- Average time spent on perceived articles that were clicked.
- Measure of clicks in response to the news and articles.
- Frequency of clicks per link within the Quick Links, and Related Sites.
Log Results
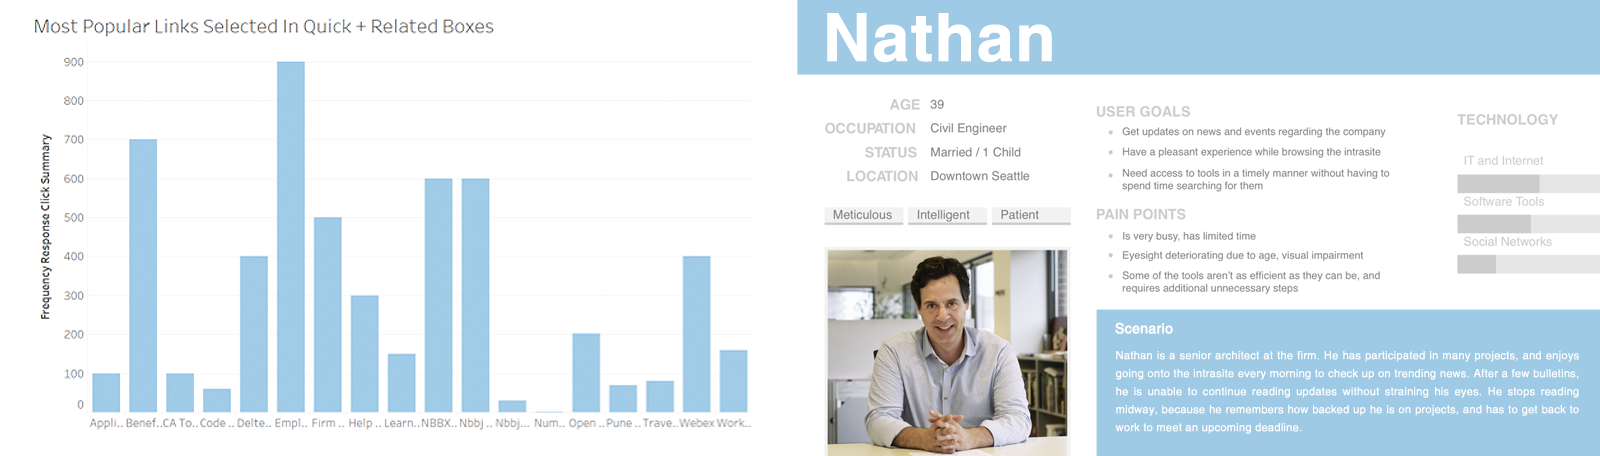
[Quantitative Metric For Measuring Sum Total Clicks.]
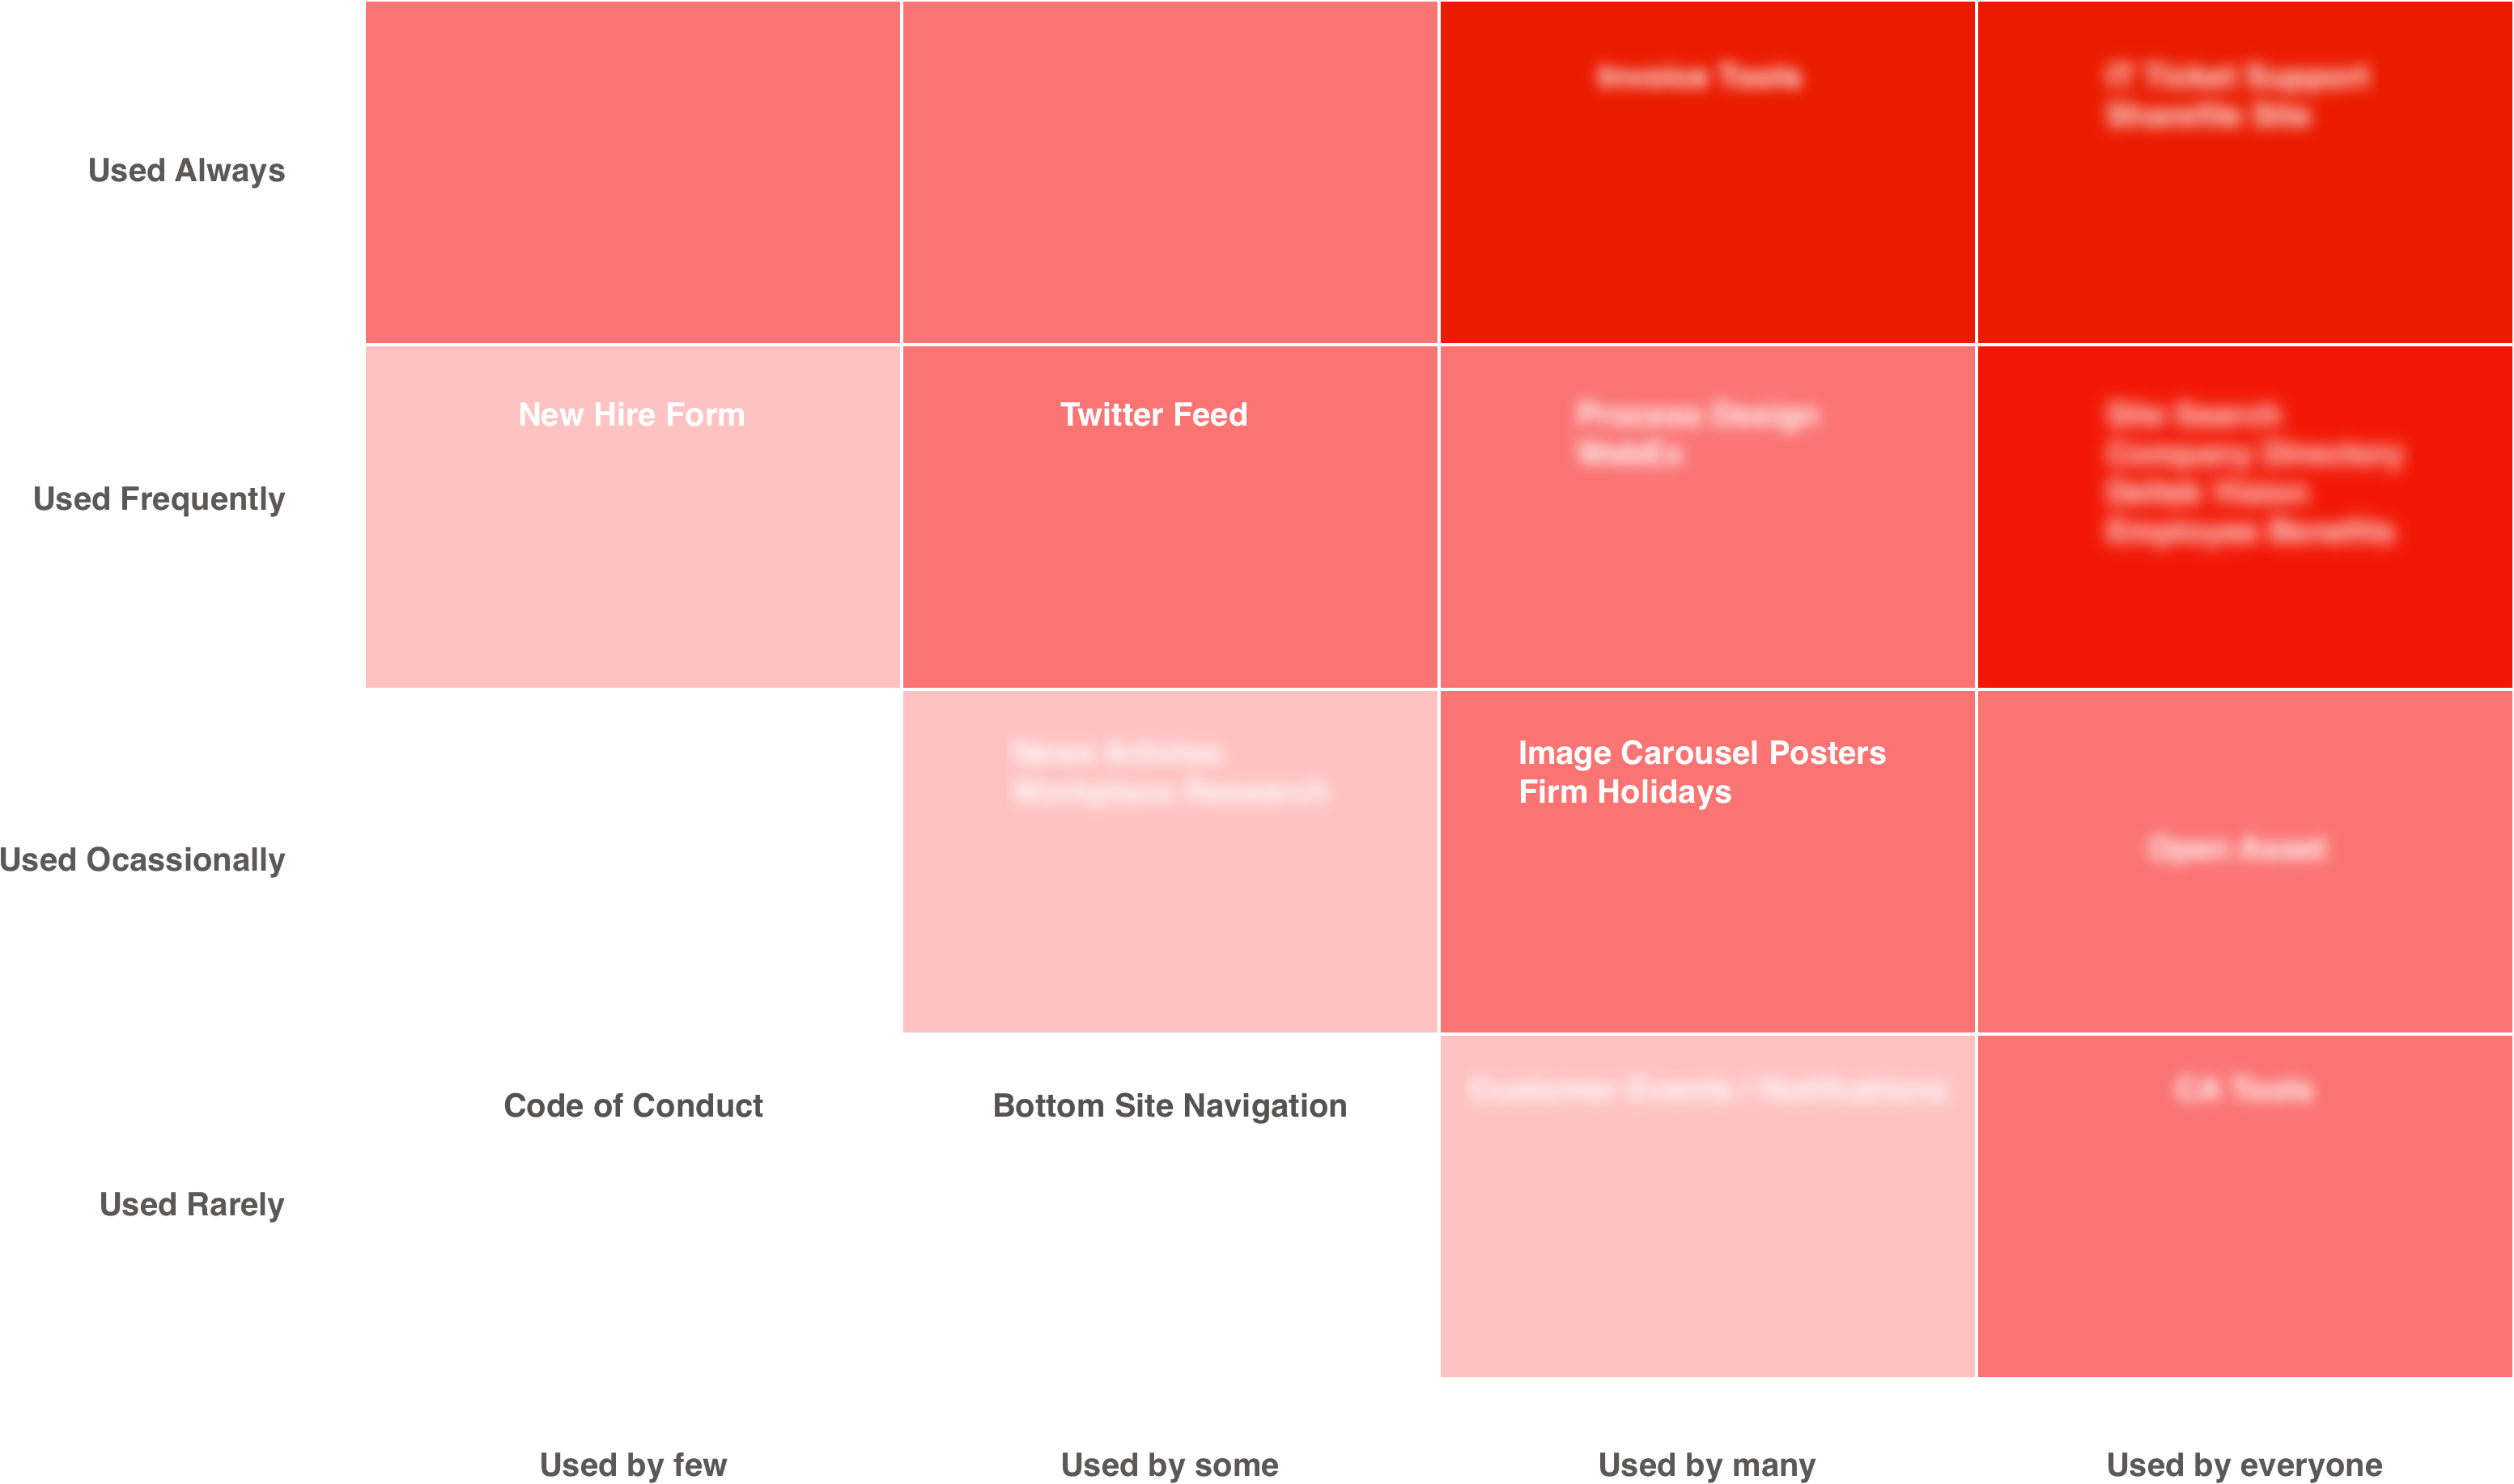
[Red Route Analysis Based On Survey Responses.]
*Data was recorded throughout a span of 29 days. We tried to normalize the data as much as possible by excluding holidays, events, anything out of the ordinary.
Results: The red route was drafted from survey responses sent out to the entire company. The responses helped us narrow down tools that we should focus on. The user personas were also drafted from the survey responses that asked for the participant’s current roles within the company. The “most popular links selected”, helped us determine which links were obsolete, and which were still in effect within the quick link and related site sections.
Wireframing
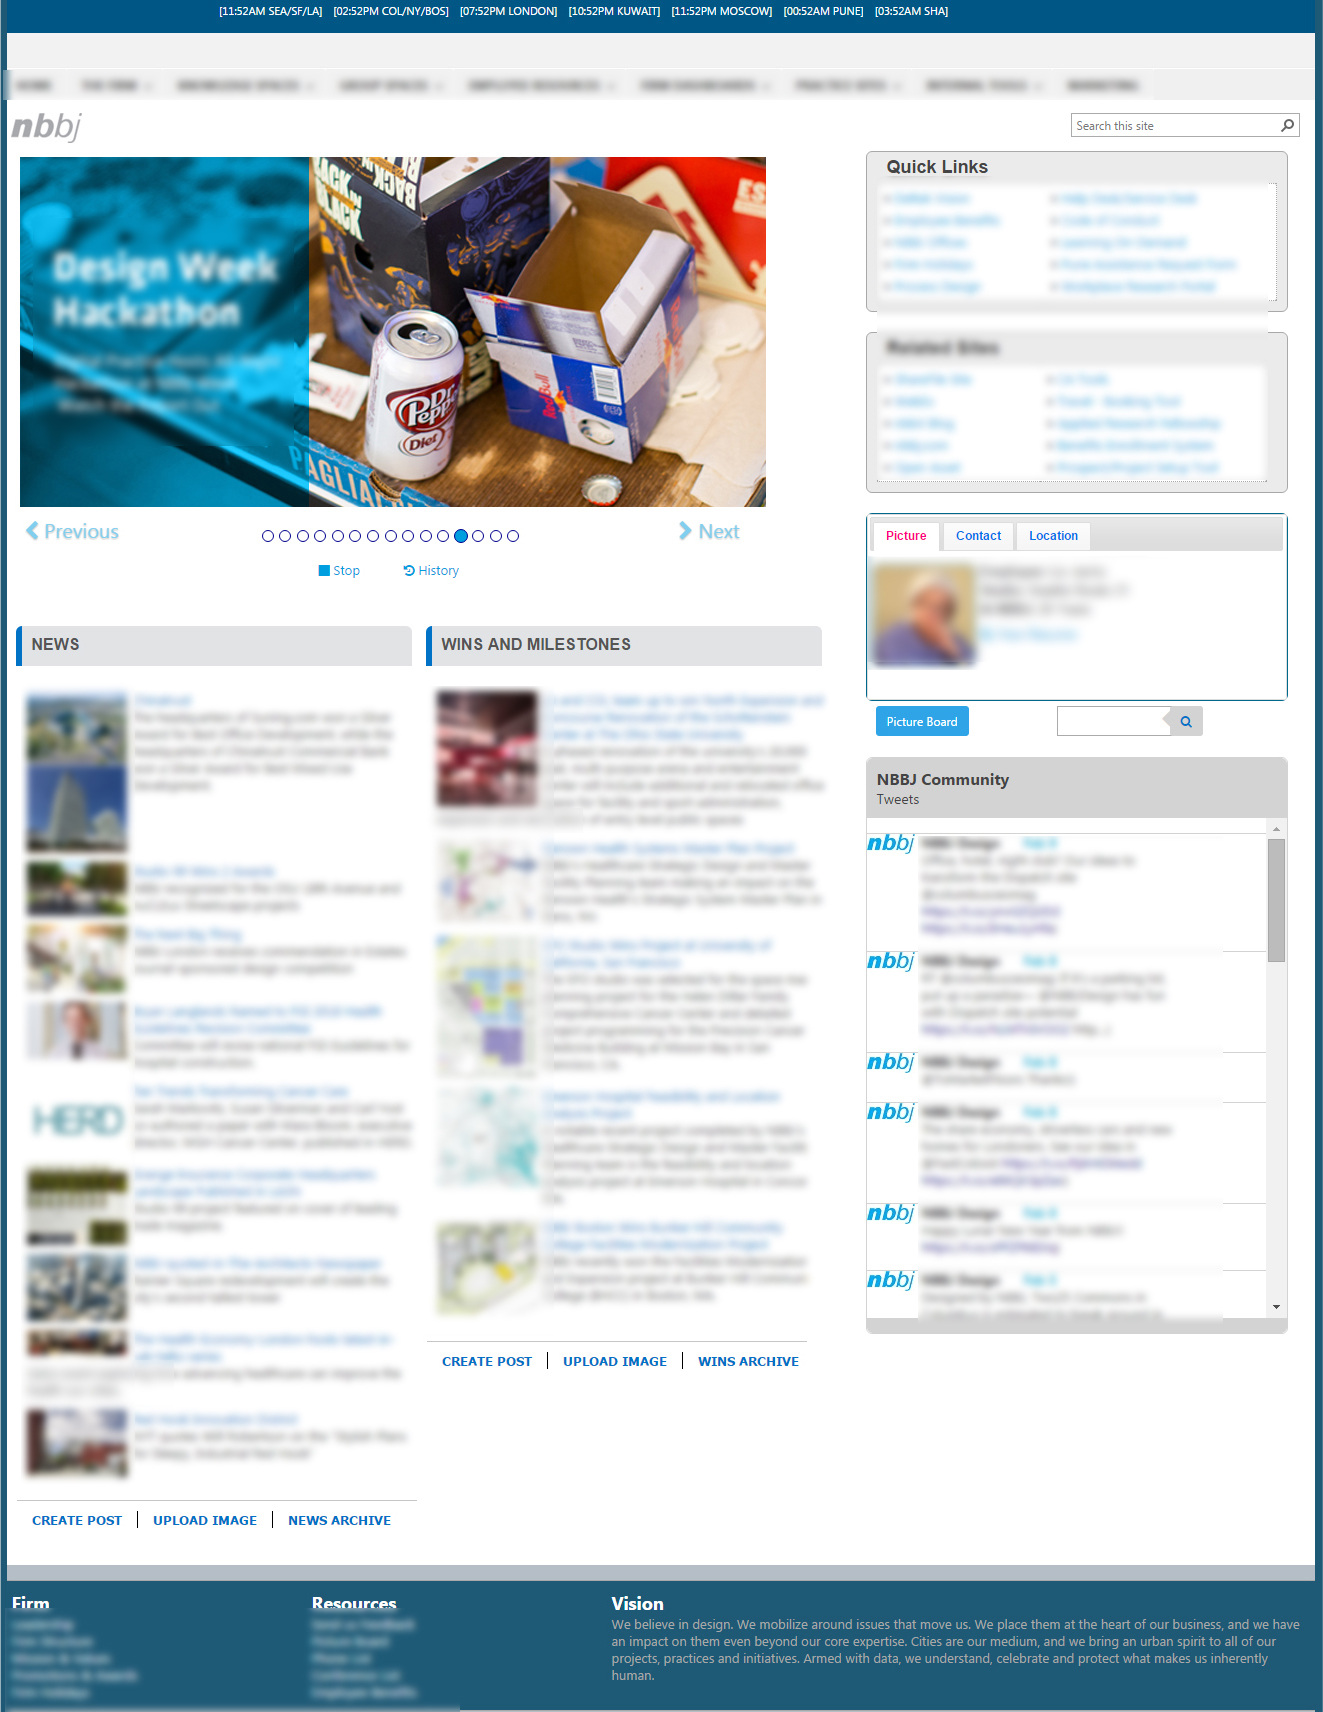
[Original Layout.]
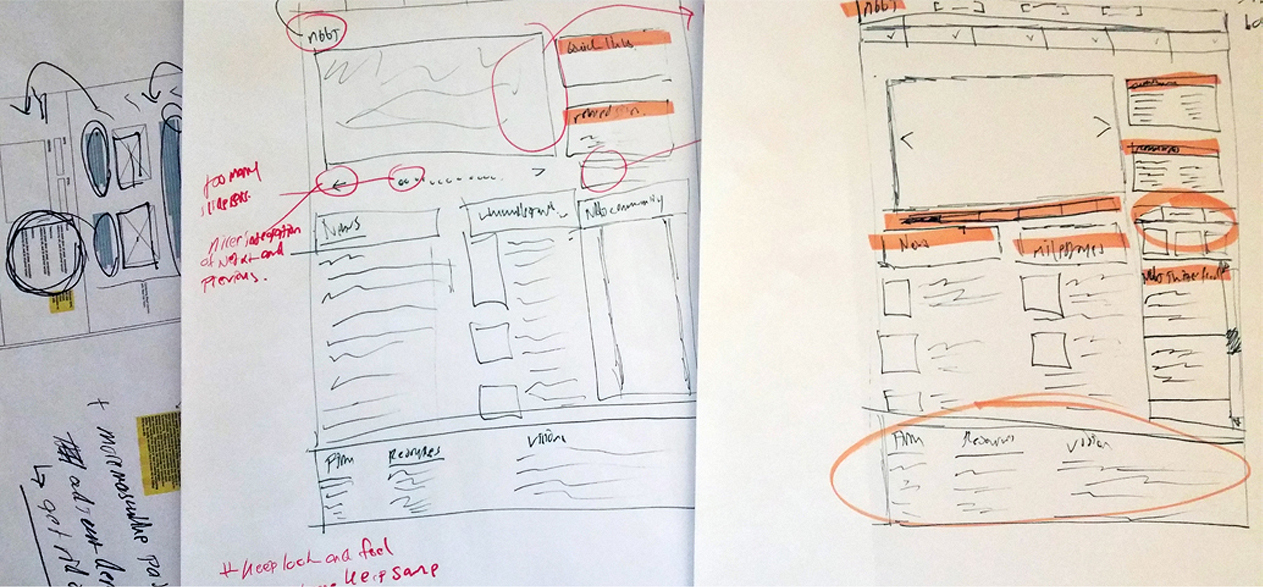
[Paper Mocks.]

[User-Experience New Layout Notes, Click Here For Hi-Res.]
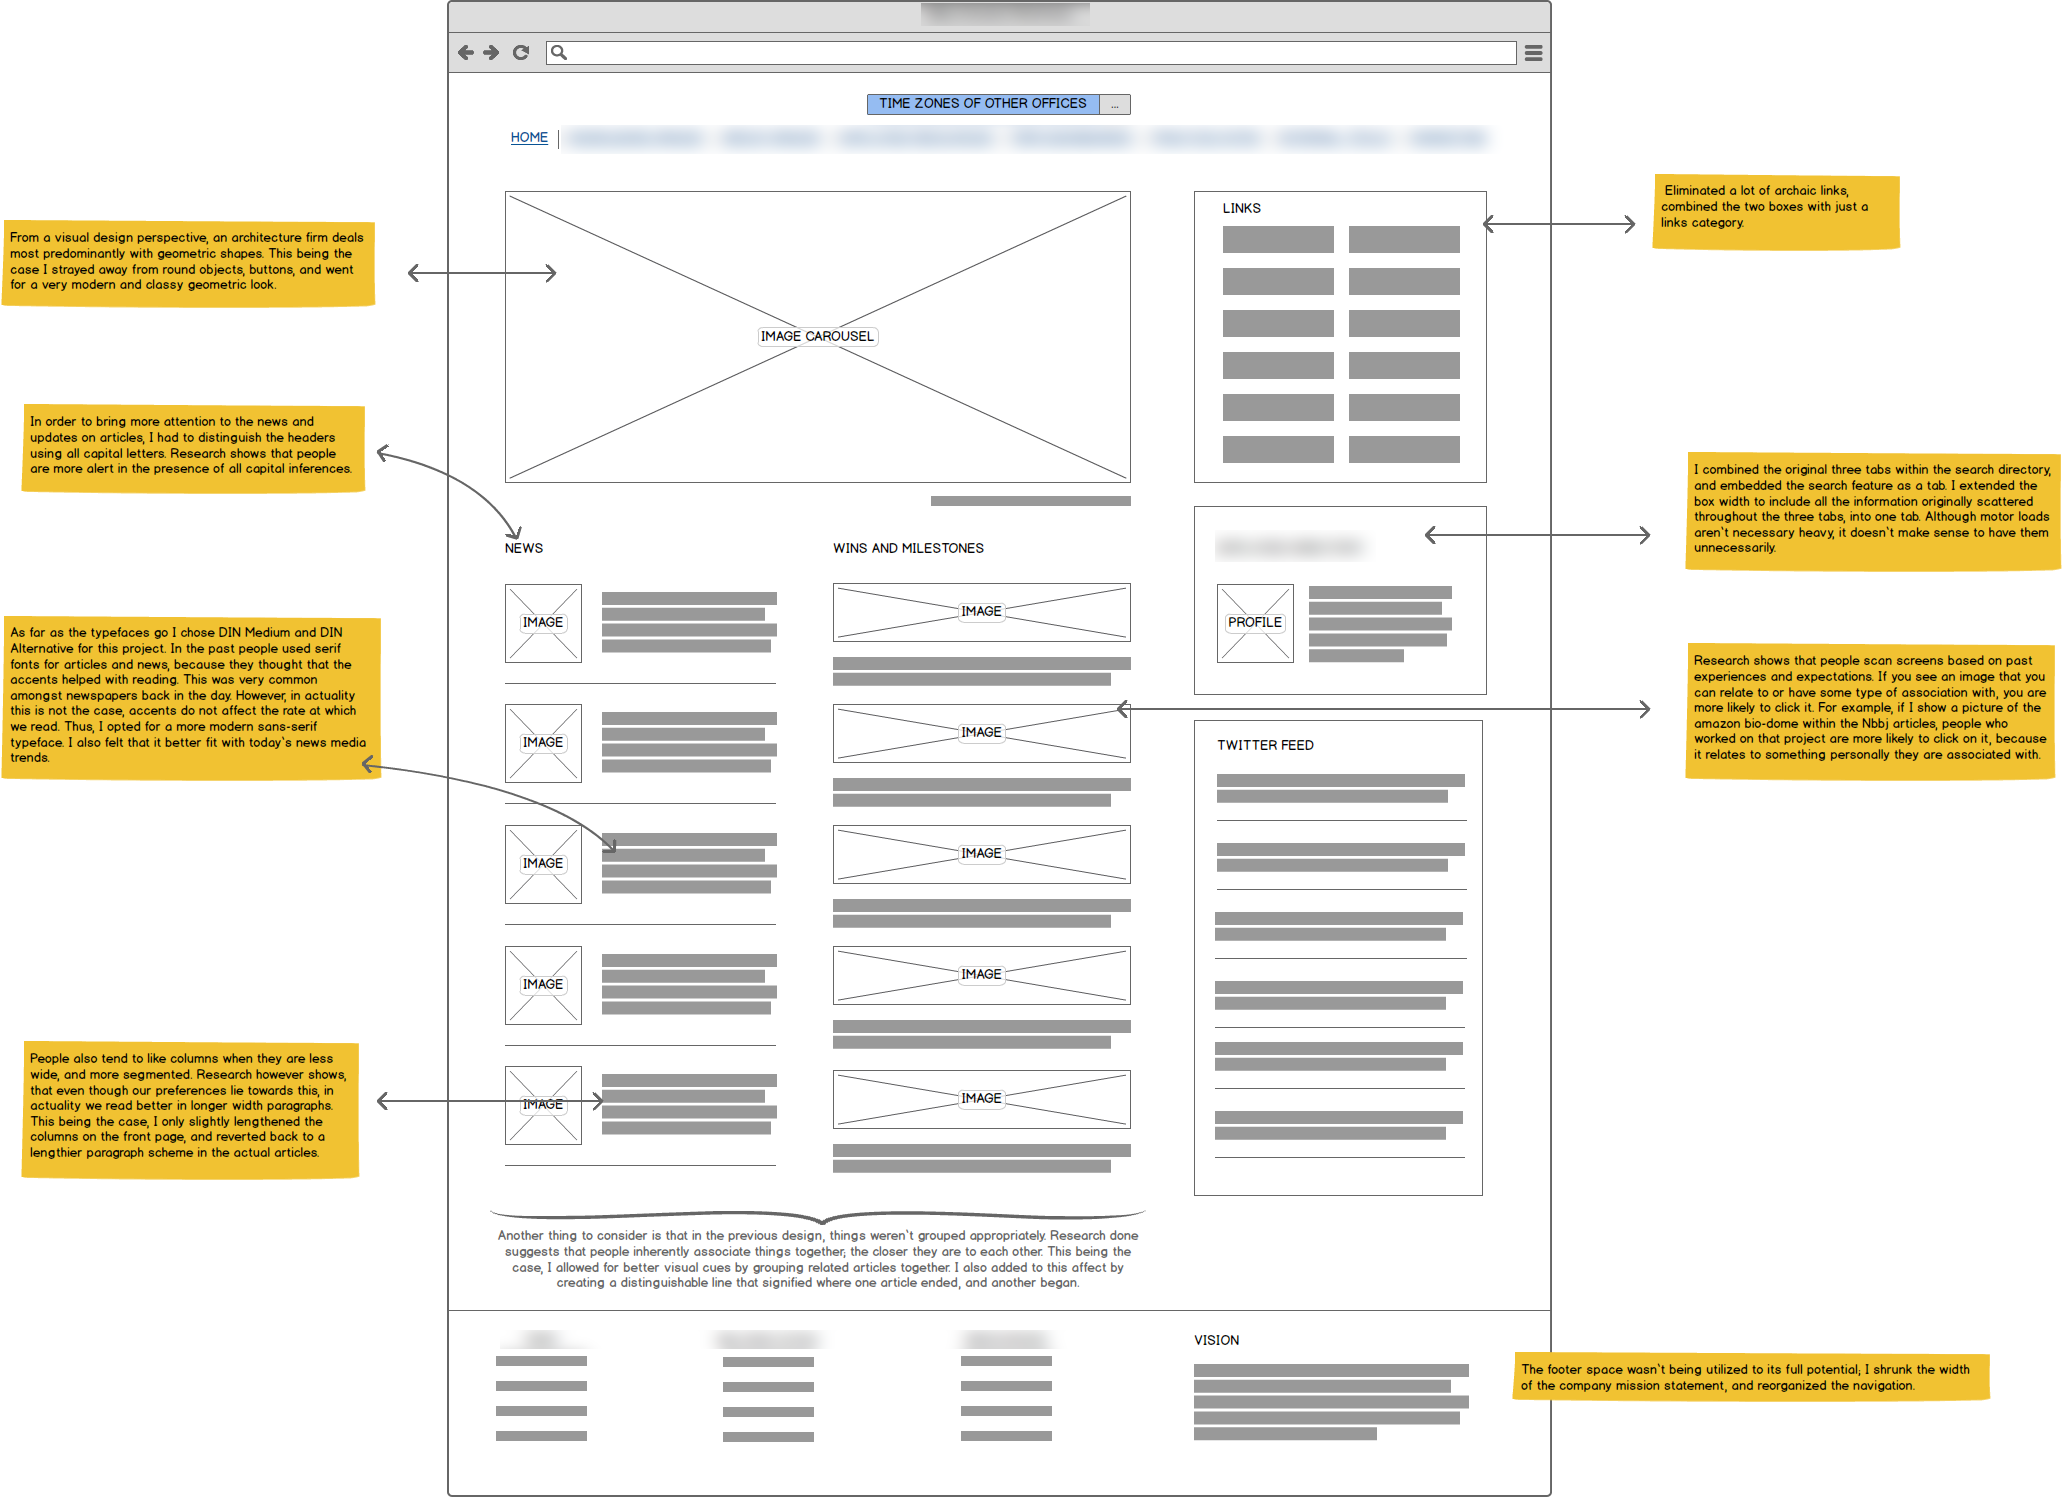
Presentation Layout
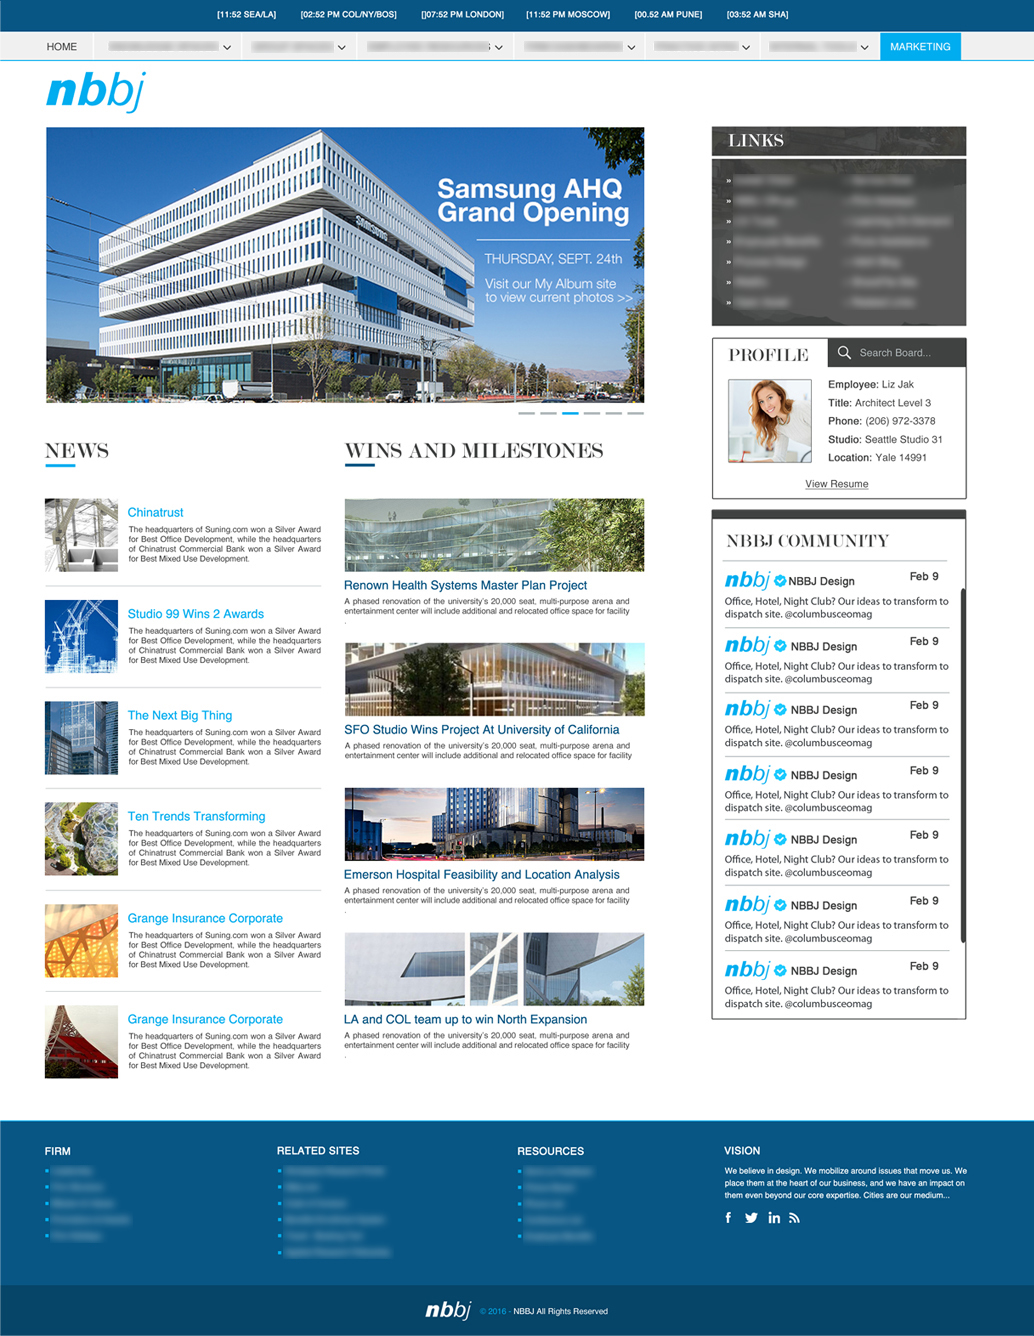
[Hard Mock 1st Iteration, presented to project manager.]
Conclusion | Impact
The study was conducted throughout a time period of 29 days, and relied on surveys, interviews, and internal automated counters to log website responses. In these studies we measured the average time spent doing a particular task, the average time spent on articles that were clicked, and the total measure of clicks as responses to news and articles. We also logged the total number of clicks of links located within the quick and related sites.
Our conclusions from the A/B Tests show that there was an overall increase in article responses after the design implementation. However, in regards to the average time spent doing a particular task, this was inconclusive on most accounts, as we did not have an accurate measuring methodology, or way of censoring out environmental noise. Although we did notice a decrease in the processing time for the time it took to search the employee directory.